AI 및 ML 개요
(1) AI : 인간의 지능을 컴퓨터를 이용해 인공적으로 구현
(2) 머신러닝 : 인공지능을 구현하는 대표적인 방법
- 기계를 인간처럼 학습시켜서 기계가 새로운 패턴을 얻어내는 방식으로 진행
- 머신러닝 알고리즘을 이용해서 데이터를 분석하고, 분석 결과를 기계에게 학습한 후에, 어떤 판단이나 예측을 할 수 있게 하는 것
- 이에, 머신러닝에서는 데이터의 양과 질에 따라 높은 성능을 이끌어낼 수 있게 된다.
- 따라서 많은 양의 데이터를 핸들링할 수 있는 역량이 필요
- 도메인 특성 이해 및 분석 방향성 설정이 중요
scikit-learn
scikit-learn은 파이썬 프로그래밍 언어용 자유 소프트웨어 기계 학습 라이브러리이다. 다양한 분류, 회귀, 그리고 서포트 벡터 머신, 랜덤 포레스트, 그라디언트 부스팅, k-평균, DBSCAN을 포함한 클러스터링 알고리즘을 특징으로 하며, 파이썬의 수치 및 과학 라이브러리 NumPy 및 SciPy와 함께 운용되도록 설계되었다 (source : 위키백과)
import sklearn
sklearn.__version__
- 라이브러리 임포트 및 버전 확인
지도학습 essential process recap 1 : 분류 모델
- 라벨값들의 불균형이 있는지 확인 필수 → 불균형 시 accuracy는 부적절함
(1) 데이터셋 불러오기 및 데이터 확인
사이킷럿 라이브러리의 내장 패키지 중 datasets에 다양한 ML 모델링용 샘플 데이터셋 및 모듈들이 있으며, iris 데이터셋은 이 중 가장 대표적인 데이터셋이다. load_iris 모듈을 import 함으로써 데이터셋을 load해보자.
데이터셋 load
from sklearn.datasets import load_iris

iris = load_iris()
iris.keys() # iris : 딕셔너리 데이터셋

- iris 데이터셋을 load했음
- load_iris는 이미 딕셔너리형태의 자료형 데이터셋
import pandas as pd

df = pd.read_csv('iris.csv')# 위 데이터셋 기반으로 미리 전처리한 데이터셋 불러오기
df.head()
- 필자는 조금 더 알아보기 쉽게 가공한 데이터셋을 load
※ 참고 : species = 품종
데이터 확인 : 컬럼명/행렬
df.columns
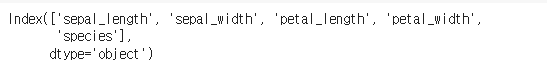
- 컬럼명 확인
df.shape- 행/열 확인

데이터 확인 : 종속변수 값들과 이들의 balance
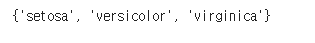
set(df['species'])
- set : 중복된 값을 제거하고, 고유한 값들만을 저장
df['species'].value_counts().plot(kind = 'bar')

- class imbalance 문제가 없는지 확인해봐야 함
데이터 확인 : 수치형 데이터인 독립변수들, 결측치 확인
df.describe() # 수치형 데이터들 확인

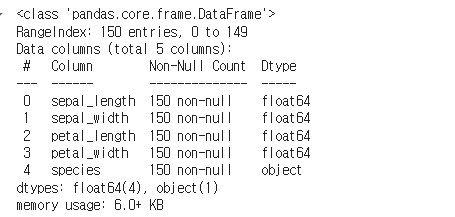
df.info() # 결측치 확인
(2) 범주형 컬럼 → 수치형 컬럼
- 반드시 필요한 작업은 아니며, 기술통계값등 확인이 가능해지므로 변형해보는 과정 추가
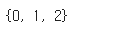
mapper = {'setosa' : 0, 'versicolor' : 1, 'virginica' : 2}
df['species'] = df['species'].map(mapper)
set(df['species'])
(3) EDA
import seaborn as sns

sns.scatterplot(data = df, x = 'sepal_width', y = 'sepal_length', hue = 'species')
- hue : 데이터셋 내의 특정 열(column)을 지정하여, 그 열의 값에 따라 데이터 포인트의 색상을 다르게 표시
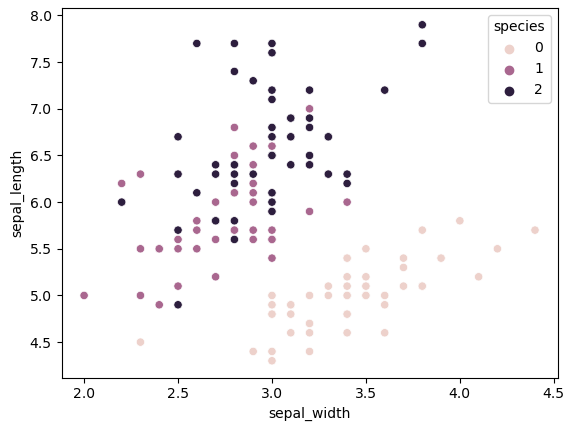
- 위의 그래프 상 0번은 잘 구분되고 있는 것 같으나, 1~2번은 섞여있음
sns.scatterplot(data = df, x = 'petal_width', y = 'petal_length', hue = 'species')

(4) Data Prep.
통합 데이터셋에서 독립변수, 종속변수 분리
feature = ['sepal_length', 'sepal_width', 'petal_length', 'petal_width']
label = 'species'

X = df[feature]
y = df[label]
tran/test 데이터셋 분리
from sklearn.model_selection import train_test_split

X_train, X_test, y_train, y_test = train_test_split(X, y, test_size = 0.2, random_state = 0, stratify = df['species'])
- stratify 파라미터 : 지정된 열의 값들이 훈련 세트와 테스트 세트에 동일한 비율로 분포되도록 하며, 이는 특히 클래스 불균형이 있는 데이터셋에서 유용

- 항상 imbalance를 유의해야함 : train_test_split API에 'stratify' 를 추가했음
→ 이렇게 해야지 accuracy와 같은 평가지표 이용 가능해짐
(5) Modeling
from sklearn.tree import DecisionTreeClassifier as dt
model = dt()
model.fit(X_train, y_train)
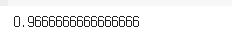
model.score(X_test, y_test)
개발된 모델을 통해 새로운값 추론하기
y_pred = model.predict(X_test)
y_pred

추론값 등 기반으로 예측 성능 더블체크
sum((y_test == y_pred) / len(y_test))
from sklearn.metrics import accuracy_score

지도학습 essential process recap 2 : 회귀 모델
(1) Data Prep.
features = ['sepal_width', 'petal_length', 'petal_width', 'species']
label = 'sepal_length'

X=df[features]
y=df[label]

X_train, X_test, y_train, y_test = train_test_split(X,y,test_size = 0.2, random_state = 0)
(2) 모델링
from sklearn.linear_model import LinearRegression as lr

model = lr()
model.fit(X_train, y_train)
평가지표 산출
R^2
model.score(X_test, y_test) # 디폴트 : R^2
MSE
from sklearn.metrics import mean_squared_error

y_pred = model.predict(X_test)
mean_squared_error(y_test, y_pred)
- 평가지표 중 _error로 끝나는 것은 전부 에러라서 작을수록 좋은 것
cross_val_score
from sklearn.model_selection import cross_val_score

score = cross_val_score(model, X_train, y_train, cv = 10)
score.mean()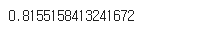
- cross_val_score는 회귀는 R^2, 분류는 accuracy를 평가지표로 활용하는 게 디폴트
Reference
https://ko.wikipedia.org/wiki/Scikit-learn